Windchill Business Analytics: Programming Journal
Part 11 - Making It Modular
Last Updated: September 18, 2016
I have always liked software that gave the user choice. As it stands, I have to code the SQL queries and graphs for each and every configuration. I do not want to do this. The program needs to be modular. I want the user to be able to fill out an XML sheet with the query and options they want to be processed by the program. The idea is that I need to just make a simple program that reads the input XML and then spits out a valid output XML that can then be read by JavaScript to display the data with the user options. It is difficult to account for every combination of options the user will want so the following is by no means a complete program. It works with a few combinations that I have chosen but it needs to be tested further.
Before we get to the code, let's take a look at the new program flow diagram with a little more detail.
Before we get to the code, let's take a look at the new program flow diagram with a little more detail.
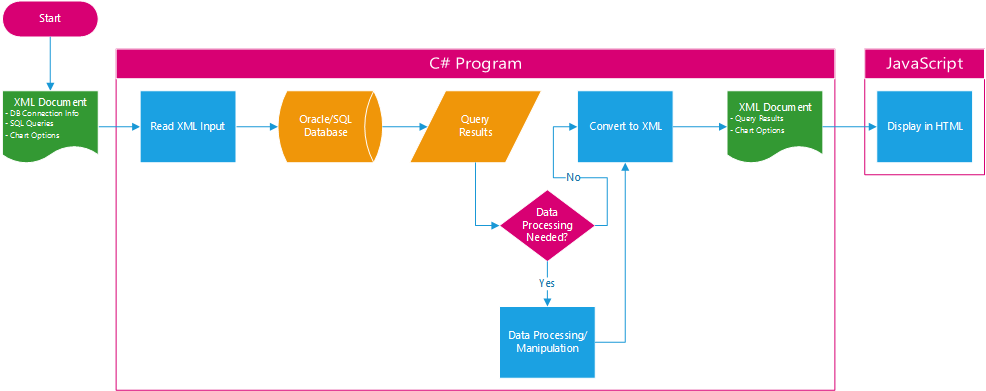
W.B.A. - Program Flow Diagram 02
Not much has changed except for the additional input XML document. Further detail on each section:
XML Document (Input):
This document will serve as the sole input file for the entire program. It contains:
XML Document (Input):
This document will serve as the sole input file for the entire program. It contains:
- DB Connection Info
- SQL Queries
- Chart Options
WBA_Config.xml
Read XML Input:
The first thing the C# program does is read the XML input file. I have separated out this portion into a separate class as shown below. I am using a few global variables to simplify the transfer of certain settings between classes.
The first thing the C# program does is read the XML input file. I have separated out this portion into a separate class as shown below. I am using a few global variables to simplify the transfer of certain settings between classes.
Config.cs
Oracle/SQL Database and Query Results:
There have been quite a few changes here. I won't go into too many details but the program now grabs query results and displays them in the console (not needed for the program to work but useful for debugging). The console results are automatically spaced out according to the largest value in each row. The Oracle data type is detected for each column and the appropriate list/dictionary is populated with those values. I decided to use a separate list just for the headers in order to not have to convert between int and string for the integer data types. The trending portion is turned off until it is made to work with the modular approach.
There have been quite a few changes here. I won't go into too many details but the program now grabs query results and displays them in the console (not needed for the program to work but useful for debugging). The console results are automatically spaced out according to the largest value in each row. The Oracle data type is detected for each column and the appropriate list/dictionary is populated with those values. I decided to use a separate list just for the headers in order to not have to convert between int and string for the integer data types. The trending portion is turned off until it is made to work with the modular approach.
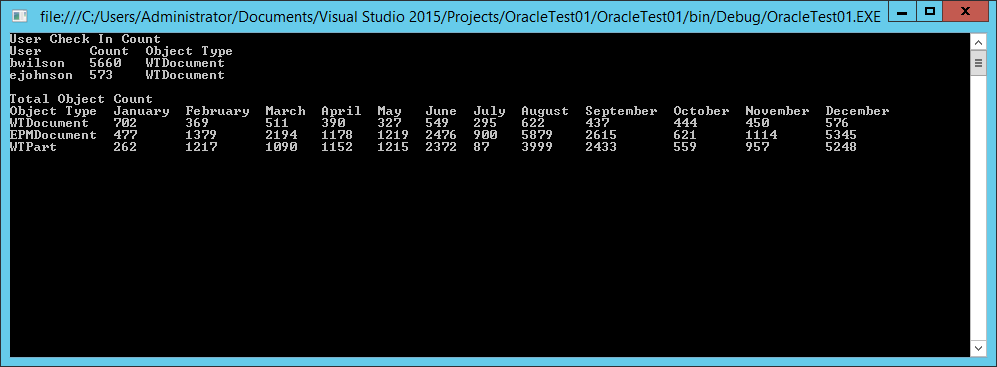
W.B.A. - Console Results 01
Program .cs
Queries.cs
XML Document (Output):
A similar XML is generated as before with a few more nodes. Most are just brought over directly as is like the chart configurations as no processing is needed for those. I have moved the XML generation to it's own class (XmlGenerate.cs) to clean things up.
I want to point out that the way I wanted this to work was for it to regenerate the entire xml file (save over existing) when the timer told it to regenerate. I had to make a variable (xmlGenInitial) to see if it was to rewrite or append to the existing file.
WBA_Output.xml
XmlGenerate.cs
Display in HTML:
This is where things start to get fun. Finally seeing the data as it would appear to the user. I had to tweak the JavaScript to loop through each query in the xml output and then display a separate table and graph for each based on the options the user provided. Where the Google Chart variables were set had to be moved around. As far as the page template, I put spots for two sets of data on the page. You can see by looking at the code how I placed the data based on the user option. There is still a little more tweaking that needs to be done like to autosize the graph with limits (for large data sets). This will be done in a later section/update.
This is where things start to get fun. Finally seeing the data as it would appear to the user. I had to tweak the JavaScript to loop through each query in the xml output and then display a separate table and graph for each based on the options the user provided. Where the Google Chart variables were set had to be moved around. As far as the page template, I put spots for two sets of data on the page. You can see by looking at the code how I placed the data based on the user option. There is still a little more tweaking that needs to be done like to autosize the graph with limits (for large data sets). This will be done in a later section/update.
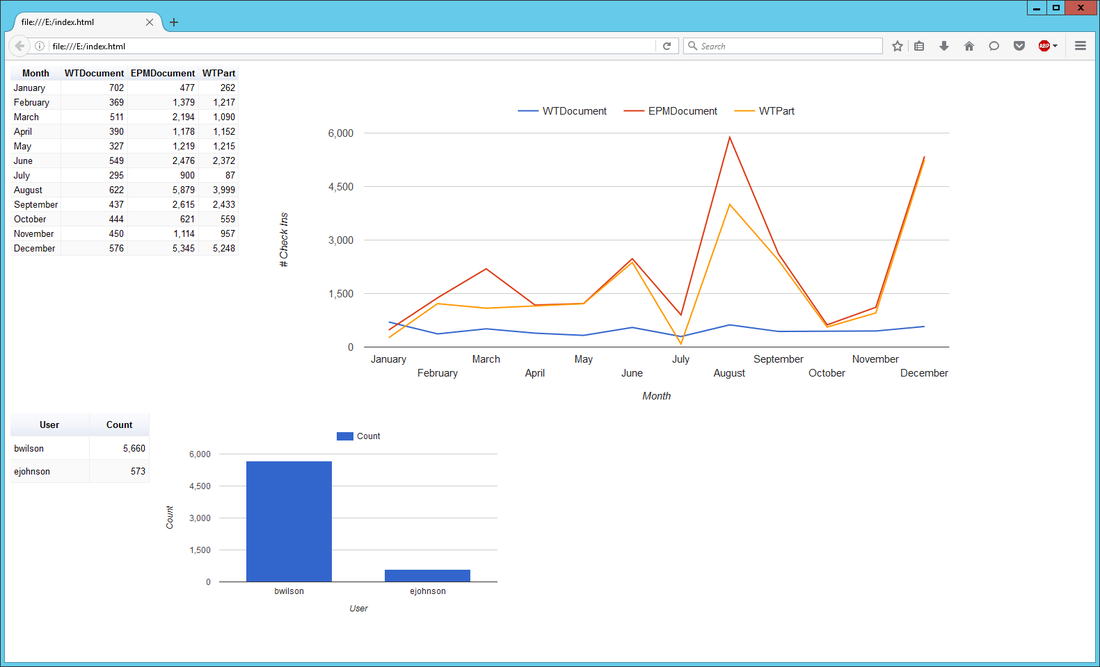
W.B.A. - User Generated Charts
index.html
And there you have it. Modular Queries and Charts. Now the user has an incentive to learn basic SQL so they can get the data they want.