Windchill Business Analytics: Programming Journal
Part 10 - Calculating Data Trends
Last Updated: September 2, 2016
It's time to start showcasing data that matters. I started this program in order to display data that was not possible to retrieve in the normal Windchill reporting route. One of the biggest items that I wanted to include is about employee productivity and that means data trends. I want to see:
If you are a manager using this, you can see if your employee is ahead, behind, or right on track compared to their other years. I hope that if an employee seems to have a very low Windchill output that the manager would see why it is in a productive way i.e. not assigning enough work, not enough help for difficult work, etc.
For my example, I am going to be looking at my own productivity in my test system. I will start by creating a new sql query in SQL Developer. Here is what I need:
- How many files a user has been modifying since they started working.
- What the average is per year the user modifies.
- Compared to the current point in time, what the productivity rate is from previous years.
If you are a manager using this, you can see if your employee is ahead, behind, or right on track compared to their other years. I hope that if an employee seems to have a very low Windchill output that the manager would see why it is in a productive way i.e. not assigning enough work, not enough help for difficult work, etc.
For my example, I am going to be looking at my own productivity in my test system. I will start by creating a new sql query in SQL Developer. Here is what I need:
- A count of all WTDocuments modified by my user since my user was first created.
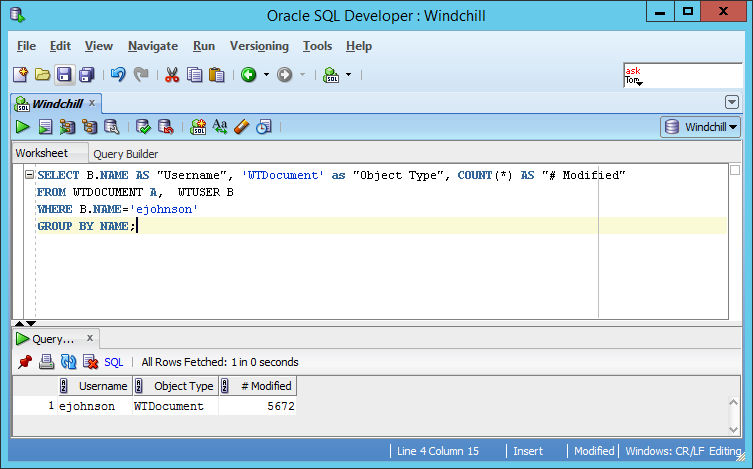
W.B.A. - Data Trend Query 01
The above query finds all WTDocuments my user has ever modified.
Next, I need:
Next, I need:
- To separate out the data by year. I am going to give a specific year here and make a loop in C# later on.
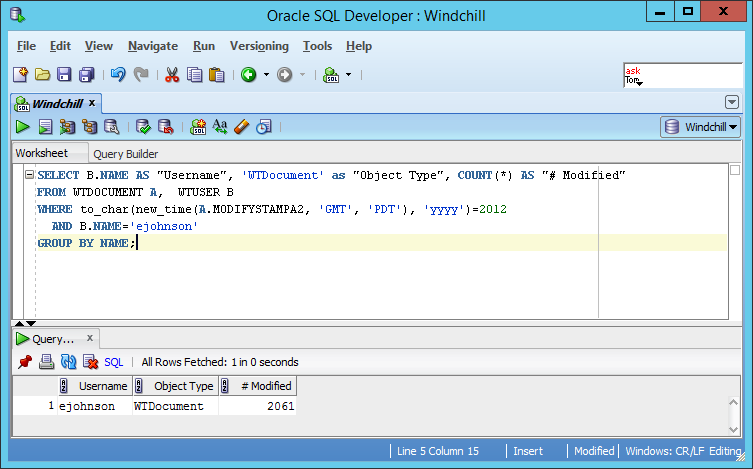
W.B.A. - Data Trend Query 02
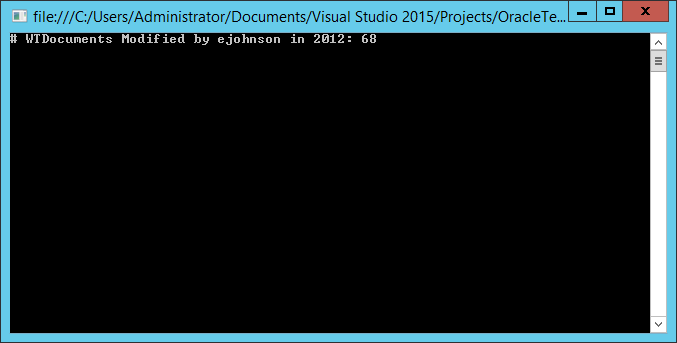
I am now getting all WTDocuments I modified in a specific year (2012). I had to convert the date to my the server's local time zone in order to get an accurate count. Windchill stores all data in the database in GMT time by default.
Next, I need:
Next, I need:
- All WTDocuments made from January 1 up to and including the current date in the same specific year.
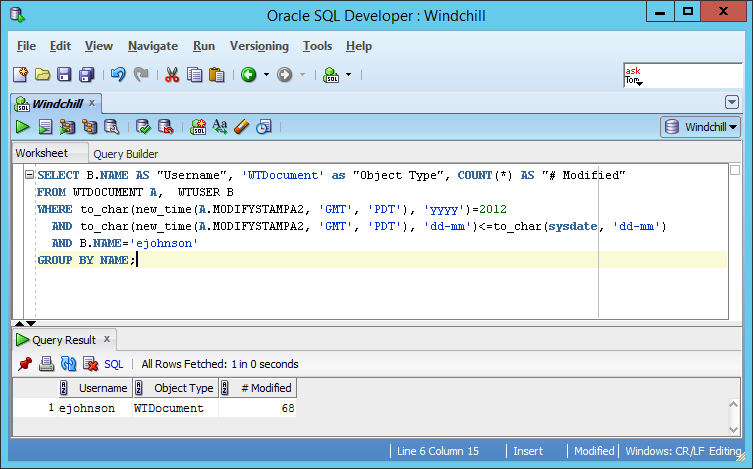
W.B.A. - Data Trend Query 03
This new iteration gives my all WTDocuments I have modified in 2012 up to the same day and month of that year that it currently is in this year. i.e. January 01, 2012 - September 02, 2012
The last piece:
The last piece:
- The query currently grabs all WTDocuments that the user created which implies that it knows when the user was created but it does not. I explicitly need to know when the user was created in order to give the user a fair first year outlook i.e. empty months will mess up first year average productivity.
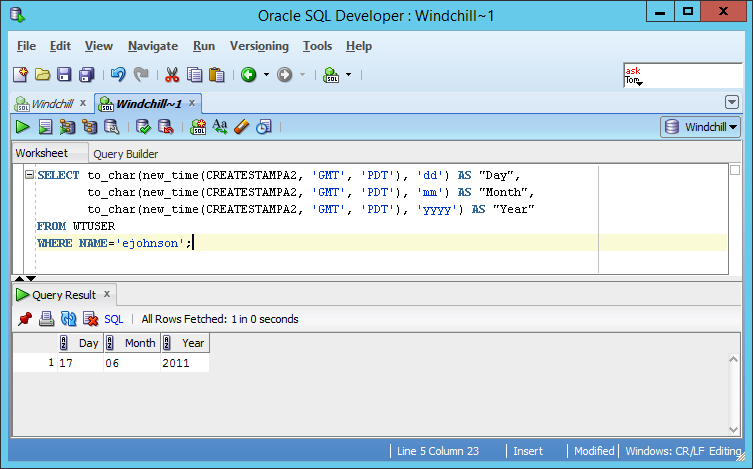
W.B.A. - Data Trend Query 04
I decided to split up the date of my user's creation in because I feel it will be easier to work with later on having to just set each cell to a variable in C#.
Since I have a working query, I need to program the logic in C#. I will start by doing a save as of an existing function (query1), rename it to queryUserInfo, and switch out the old SQL query with the new one.
Since I have a working query, I need to program the logic in C#. I will start by doing a save as of an existing function (query1), rename it to queryUserInfo, and switch out the old SQL query with the new one.
The only thing I want to point out here is that I had to convert the date to and integer. No onto the queryUserTrend query when the trend calculation will be performed through the data obtained from the first SQL query.
Queries
W.B.A. - Data Trend 01
Additional changes I have made:
Time to convert this to a loop and calculate the average after each year.
- Replace single " with double "" in my SQL query.
- Adjust the Data Reader to read column 3 instead of 1.
Time to convert this to a loop and calculate the average after each year.
W.B.A. - Data Trend 02
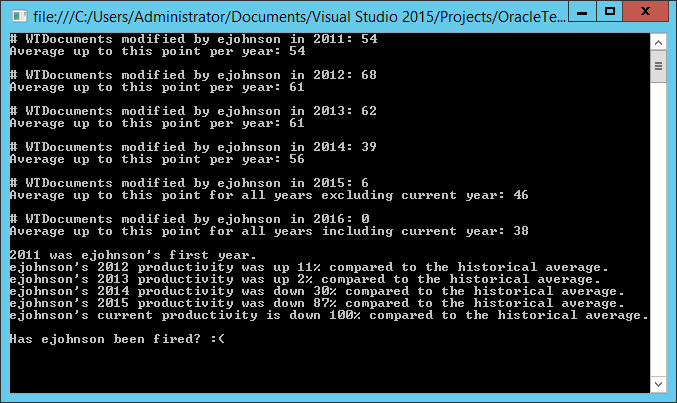
The code looks more complicated than it is. I am simply looping my query for each year since the user was created, calculating the average up to the selected year, storing the data in the userData array and then using that data to determine the percent productivity change.
The plan is to graph the historical average for each year to visually show productivity change. The % change calculation is more to quantify the change to the manager without relying on JavaScript as that may contribute a slower refresh rate. I intend to show this data as well since there are people out there who prefer numbers over graphs.
The plan is to graph the historical average for each year to visually show productivity change. The % change calculation is more to quantify the change to the manager without relying on JavaScript as that may contribute a slower refresh rate. I intend to show this data as well since there are people out there who prefer numbers over graphs.